Air Quality Monitoring Delivery

About this blog
I created this solution as part of Azure Blogathon event 2022 Phase 3, For more info about this competition please go to this website : https://azureblogathon.com/
What problem are we trying to solve today?
We know that the intensity of air pollution is increasing all over the places, yet we are ignoring this fact in an assumption that we are immune to it. It is found recently by scientists that how bad this could impact us. Health impacts extends way beyond the respiratory illness. Through research it is found that , foetal development ,mental health and metabolic syndrome are impacted due to increase in air pollution.
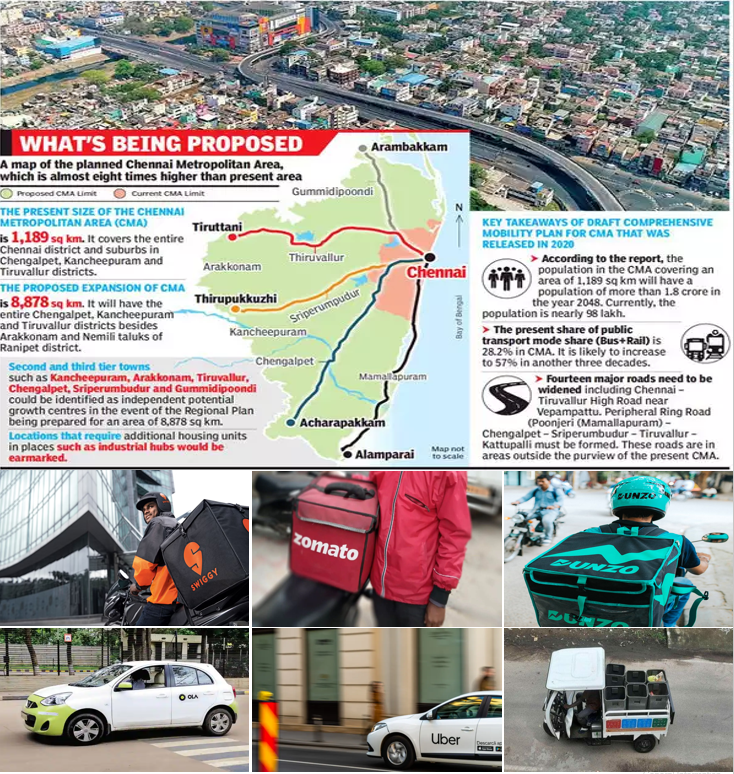
Based on Dr. Sarath Guttikunda article, “A general understanding is that an ambient monitoring station can represent an area covering 2 km radius, which translates to 15 sq.km (rounded off).” But if we consider Chennai Metropolitan area, it is spread across 1189 sq km (planned to expand up to 8878 sq km), whereas we have only 8 air quality monitoring stations as of 23rd Jan 2023. It is evident that we don’t have enough stations to cover entire area.

Proposed solution
Proposed solution is to make use of BOV Garbage Collector, food delivery partners/ Cabs (Ola, Uber, Swiggy, Zomato …etc.) to mount the air quality sensor that detects PM 2.5, 10 concentrations in the air and visualize it as a live heat map. It will be an effective solution than ambient monitoring station as it shows us exactly where the intensity of air pollution is higher on street basis.
Public Survey
Before proceeding with the solution , public survey has been conducted with various people who works for Uber ,Ola, Zomato, Swiggy etc.…

Architecture
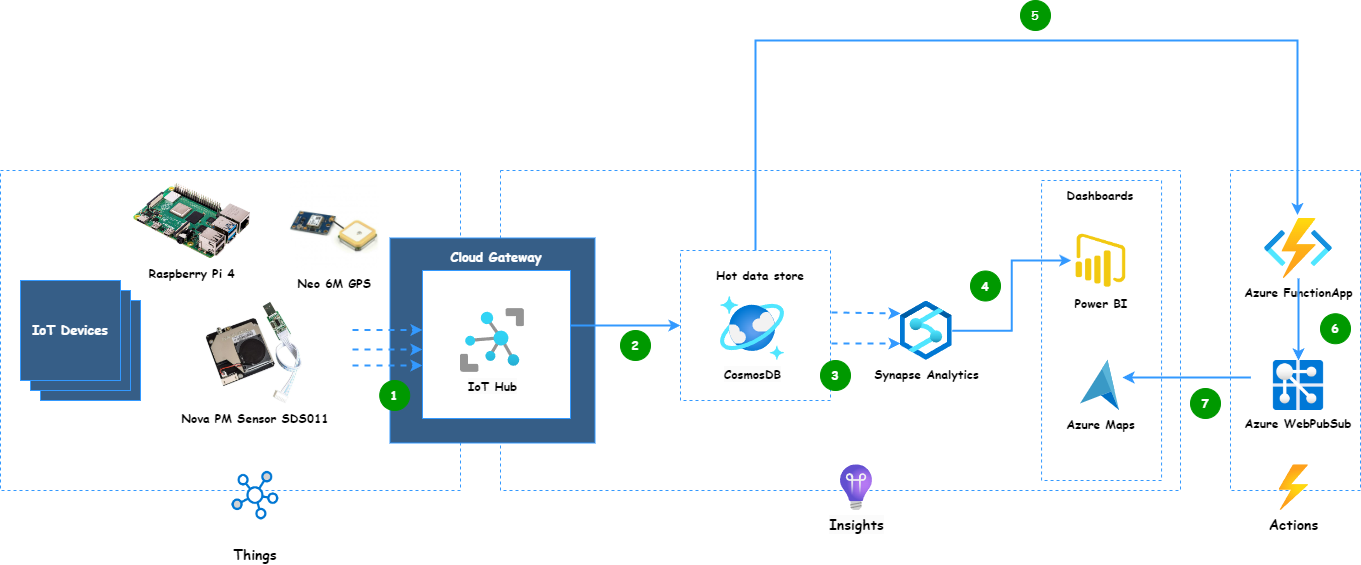
DataFlow
- IoT devices push the telemetry to cloud gateway (IoT Hub)
- Message routing feature of IoT hub enables us to forward the telemetry to different store path. In our proposed architecture we have used Azure Cosmos DB as a hot store path to store data. Azure cosmos DB is ideal for IoT workloads as it is highly capable of ingesting high volume of data at low latency and high rates. IoT hub is also capable of filtering only specific messages to be pushed into Azure Cosmos DB.
- Hybrid Transactional and Analytical Processing (HTAP) capability of Azure Synapse link for Azure Cosmos DB integrates data into analytical store which is highly efficient for analytical purposes.
- Power BI helps us to visualize data in a Azure Map layer. Heat Map is used in our proposed architecture to better depict our scenario.
- Azure Cosmos DB change feed triggers an Azure Functions
- Change Feed trigger is used to publish the message to a Azure Web PubSub service
- As a presentation layer we have a Azure Map integration in a web app and with the websockets we will have near real-time updates about the telemetry and could visualize it.
Device Setup

Connect PM sensor and GPS module with RaspberryPi
- I have used USB 2.0 to TTL UART serial converter module for connecting PM sensor with Raspberry pi , which could be easily plugged into the USB port.
- GPS module doesn’t come with a soldered header pins. Hence we need to solder berg strip male connectors (4 pins) on the GPS module, prior to connecting with RaspberryPi 2.a. For connecting Neo6M GPS module , jumper wires are required to connect with RaspberryPi. Follow the pin out diagram below for establishing connection between them. 2.b. Optionally you can skip the jumper wire part connection to RaspberryPi module , if you have an extra USB 2.0 to TTL UART serial converter.
RaspberryPi setup
- Setting up RaspberryPi can be done by following the official documentation here .
- After the setup is done , use command prompt to enter raspi-config or under Preferences->select RaspberryPi Configuration.
- Enable Serial Port interface.
PM2.5 & PM10 safe levels

Azure Iot Hub Setup
Create Iot Hub
- Azure subscription is required and you can create a free account here.
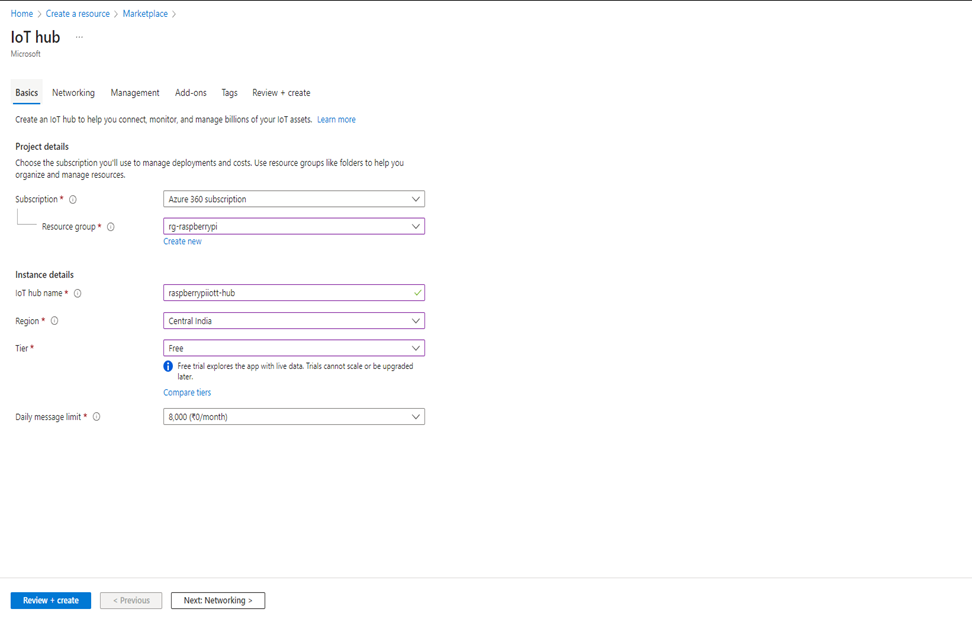
- Create an IoT Hub by clicking on + Create a resource button or using the search bar.
- Choose a subscription and create a resource group “rg-raspberrypi” if not created one earlier Provide IoT hub name and choose the region closest to you
- For the tier I have started with Standard tier , but Free tier should be more than enough for testing and evaluating AQMD.
- Daily message limit can be updated based on the preferences for higher tier, however for the free tier we should go with the default one which is 8000 message per day quota.
- Proceed to the next step Networking and accept the defaults for now and click on next step Management , you can optionally change the permission mode and assign yourself the contributor role.
- Proceed to the final step and click on Create button.

Register device
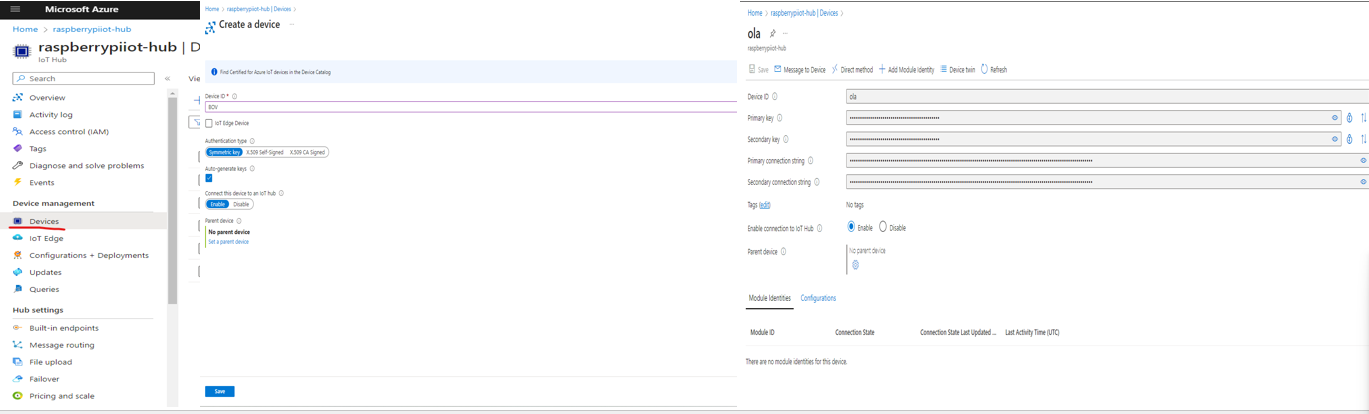
- Under the device management in the left pane , click on Devices, then select Add Devices button
- In the Create device pane , mention the device ID (Ola, Uber, Zepto, BOV, etc..) from which we will be collecting the telemetry.
- Let’s leave the default authentication type and let’s use auto-generate keys
- Once you click on Save button , device will be created along with autogenerated connection string for you to connect with.
IoT Hub Message routing
- For the hot store path we will make use of Cosmos DB, prior to this step make sure to Create a Cosmos DB in a serverless mode. Follow the steps here to create Cosmos DB.
- Create account name as cosmos-raspberrypi , database name as airqualitymonitoringdelivery and collection as telemetry with synthetic_key as partition key.
- Now all the telemetries from IoT Hub should be ingested to this hot store path. In order to do that we should create a Message routing that routes all the data to Cosmos DB.
- First step is to create Custom endpoints. In our case it is Cosmos Db ( at the time of creating this blog , this feature is still in Preview)
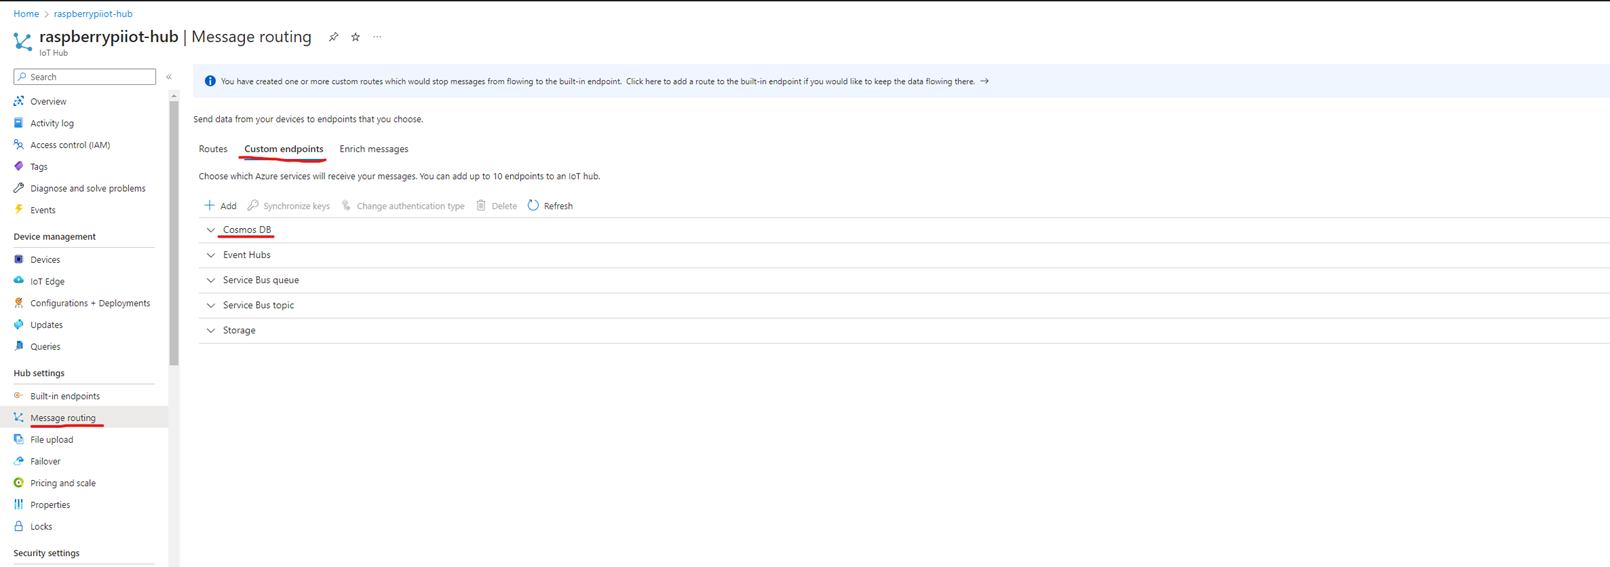
Cosmos DB Custom endpoint
- Provide a name for the Cosmos DB endpoint
- Choose the Cosmos DB account and respective collection to which the data should be ingested into
- Choose Synthetic partition for the message
- Provide the partition key template
- Leave the default authentication type
- Click on create button

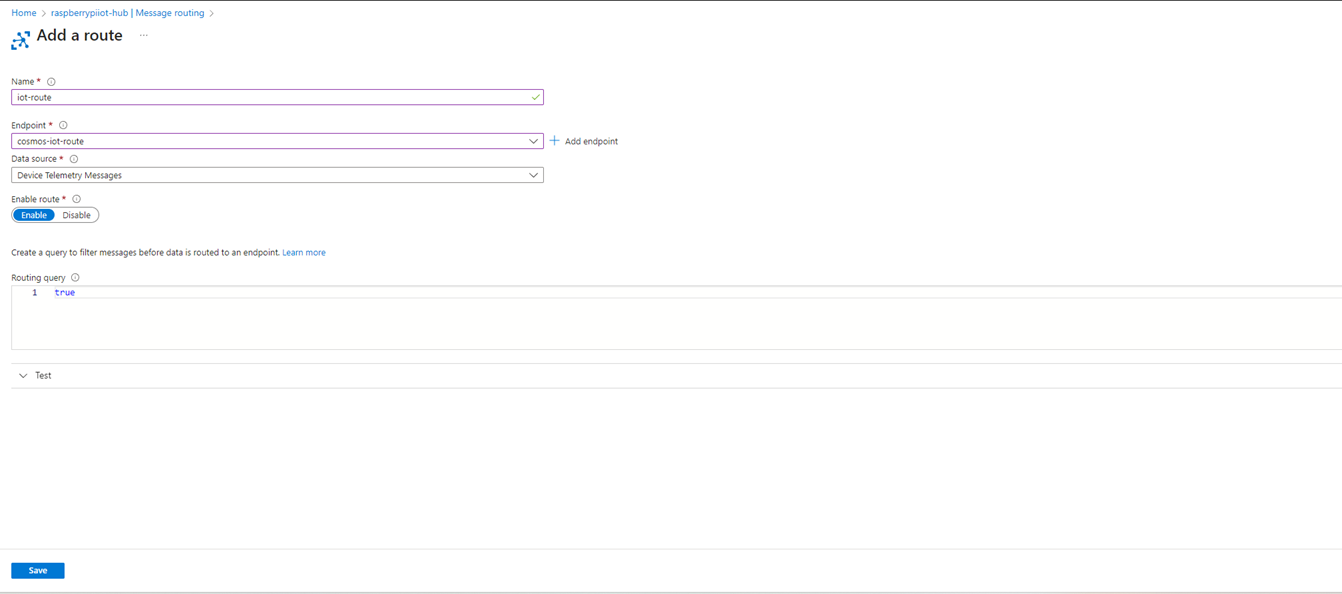
Add IoT Hub routes
- Click on Add routes
- Provide a name for the route
- Select the Cosmos DB endpoint created in the previous step
- Choose data source to be device telemetry messages
- Select Enable route
- Optionally you can modify the routing query to push only specific messages to Cosmos Db , In our case it is set to true ( push all messages to Cosmos Db)
Azure Synapse flow
Enable Azure Synapse link for Azure Cosmos DB
- Now that we have ingested data into Azure Cosmos DB , next step is to visualize and analyze the data to get meaningful insights from the telemetries
- Azure Synapse link provides a cloud-native hybrid transactional and analytical processing (HTAP) capability that enables near real time analytics over operational data in Azure Cosmos DB.
- Under Integrations in Azure Cosmos DB account , select Azure Synapse Link and click on Enable button
- Once Azure synapse link is enabled, make sure to choose the collection if it is created already and create a workspace in the next screen.


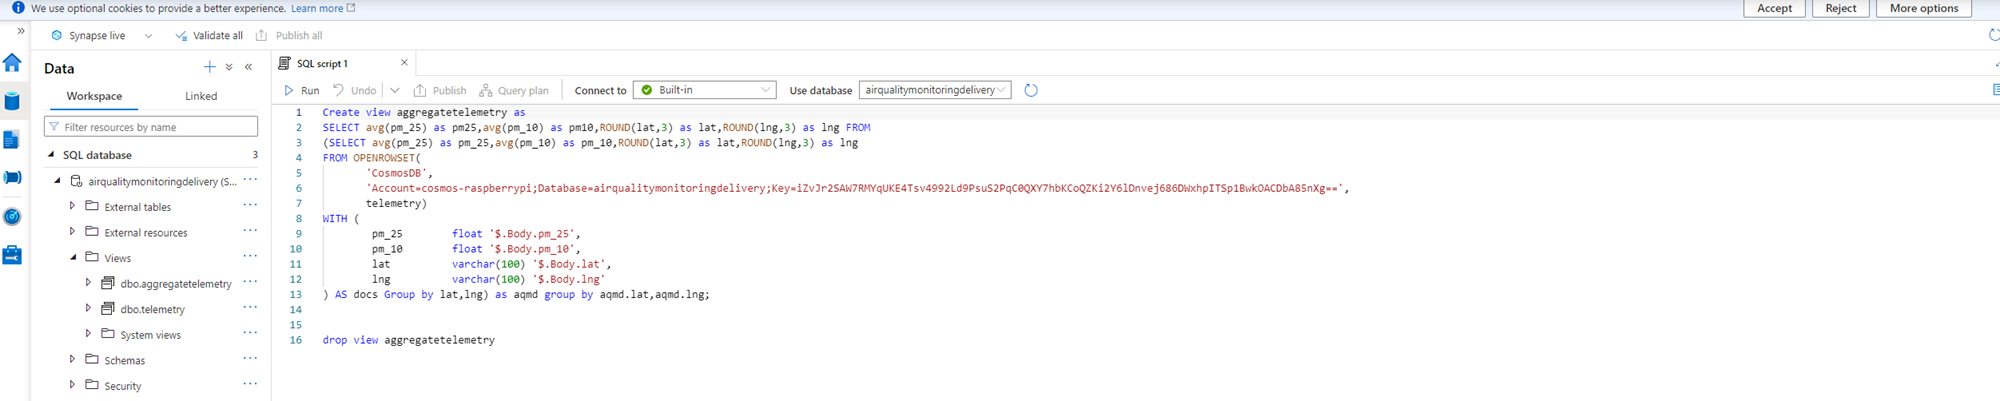
Create SQL View in Azure Synapse analytics workspace
- Enter into the Azure synapse analytics workspace
- Select the database “airqualitymonitordelivery” in the top pane and proceed to create a view
- Create a view named “aggregatetelemetry” which aggregates the data by rounding off latitude and longitude to 3 points, to avoid any discrepancies while visualizing the data as a heatmap
Power BI Integration
- Sign up for a free Power BI account if you don’t have one here.
- You can optionally download Power BI Desktop tool from here or you can use app.powerbi.com
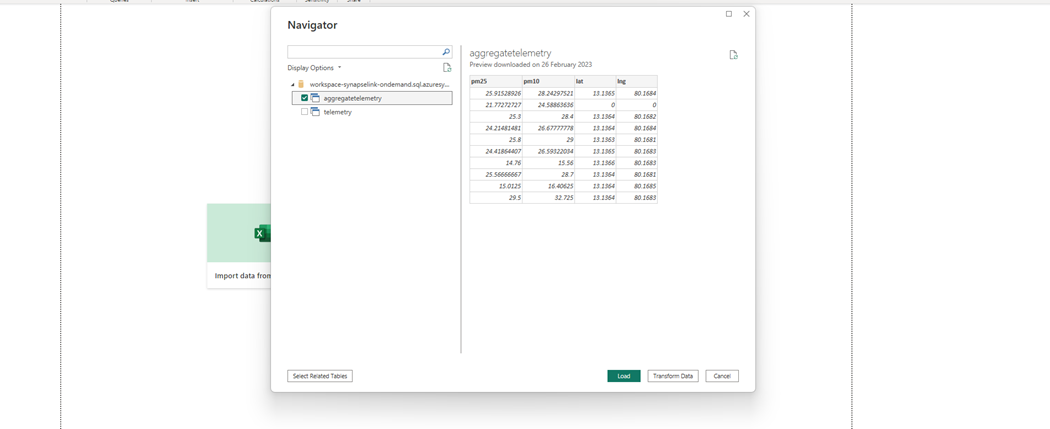
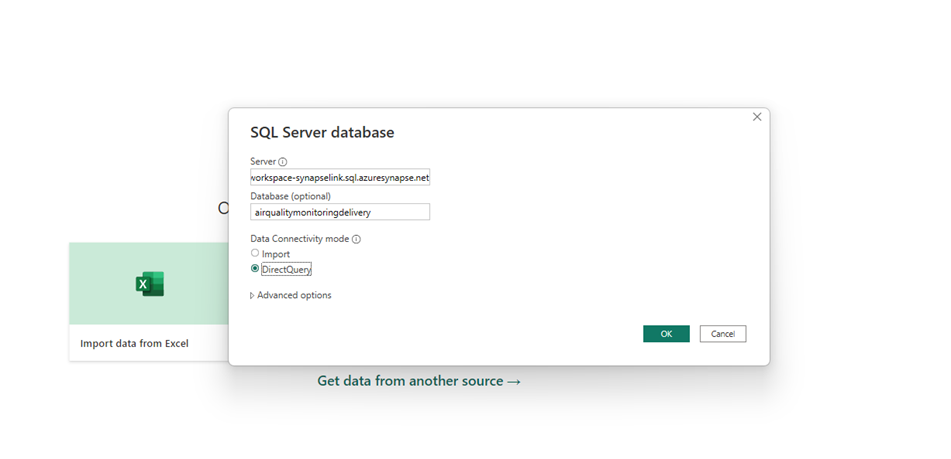
- Select Import data from SQL server.
- Provide the connection details (Serverless SQL endpoint) in the server text box and choose DirectQuery as Data Connectivity mode
- Click on OK button
- In the next screen , sign in if prompts and then click on connect button.
- Now Choose the view created in the earlier step and click on Load button

Python code to send telemetry
|
|
Real-time Azure Maps flow
Create Azure Web PubSub
- Azure subscription is required and you can create a free account here.
- Create a WebPubSub instance by clicking on + Create a resource button or using the search bar.
- Choose a subscription and create a resource group “rg-raspberrypi” if not created one earlier
- Provide Resource name and choose the region
- For the tier I have chosen Free tier, that should be more than enough for testing and evaluating AQMD.
- Proceed to the final step and click on Create button.
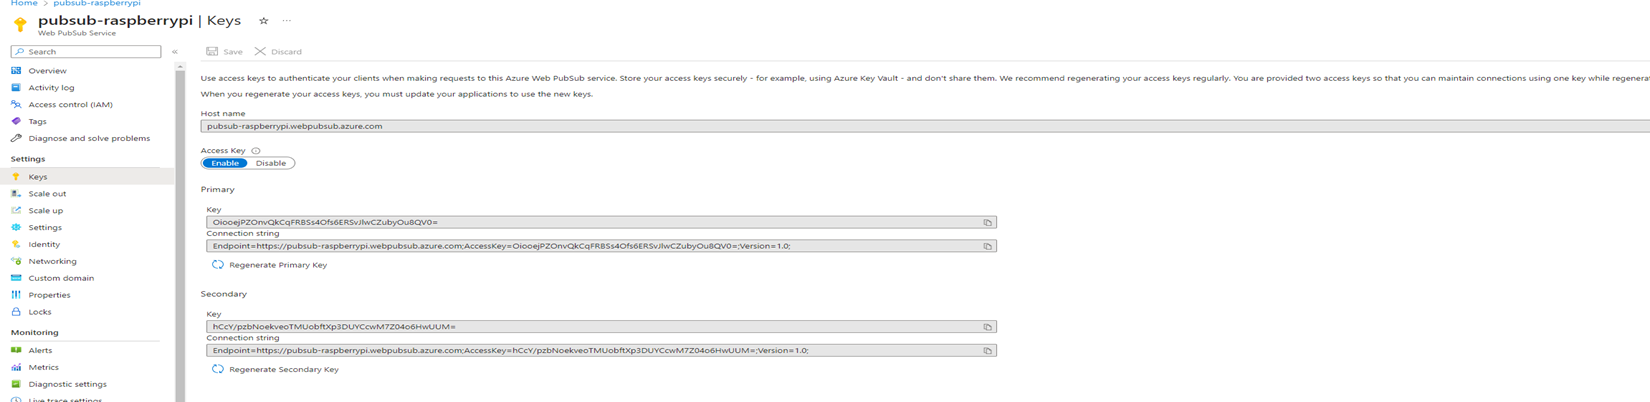
- After resource is created add a hub (AQMD) to the instance
- Copy the ConnectionString from the key session

C# code – Telemetry trigger
|
|
C# code – Get Connection URL for Web PubSub
|
|
HTML code
|
|
Ride with AQMD
It is optional to buy a case for raspberry pi model . In my case I have bought a case to hold my touch screen + raspberry Pi. Myself and my wife decided to take it for a ride in and around our residence (Ambattur estate). Outcome of the ride can be seen in the next slide, which feels more accurate as we felt the same before while crossing those streets!

Heatmap

Github Source code
https://github.com/Cloud-Jas/AQMD
Future scope
- LoRaWan could be even more efficient solution
- Support from public and government to implement this solution
Sponsor
If you find this post helpful, please consider sponsoring.
